Search posts
The trouble with the curve
The US economy is recovering. The extremely accommodative monetary and fiscal policy will support solid growth over the near-term. President-elect Biden’s administration will provide even more fiscal stimulus following the Georgia run-off election wins. The big picture points to a recovery in real growth and inflation.
It is time to focus on the curve.
The US Treasury yield curve captures the difference between 10-year and 2-year Treasury yields. The yield curve has been a remarkable predictor of economic cycles over the past decades. A negative curve – where 10-year bond yields are lower than 2-year bond yields – has predicted every recession over the past 5 decades. When the curve inverted in 2019, it was a signal for anyone watching to build more resilience into their portfolios.
Figure 1: The US Treasury yield curve is steepening.
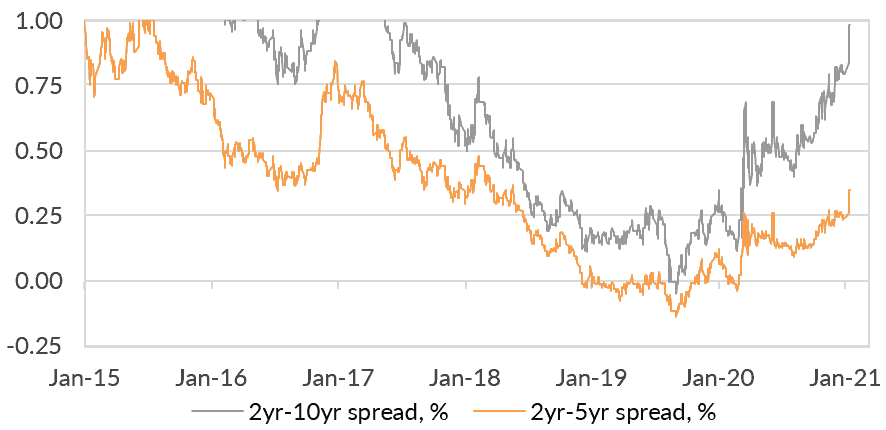
But curve steepening is also important to focus on. It is important for what it says about the economic recovery. And it is important for what it says about investing.
Real yields have lagged
Figure 1 shows the nominal curve is steepening. It is at its steepest levels since 2017. That steepening has accelerated since August, when financial markets began to price in a Biden-led administration.
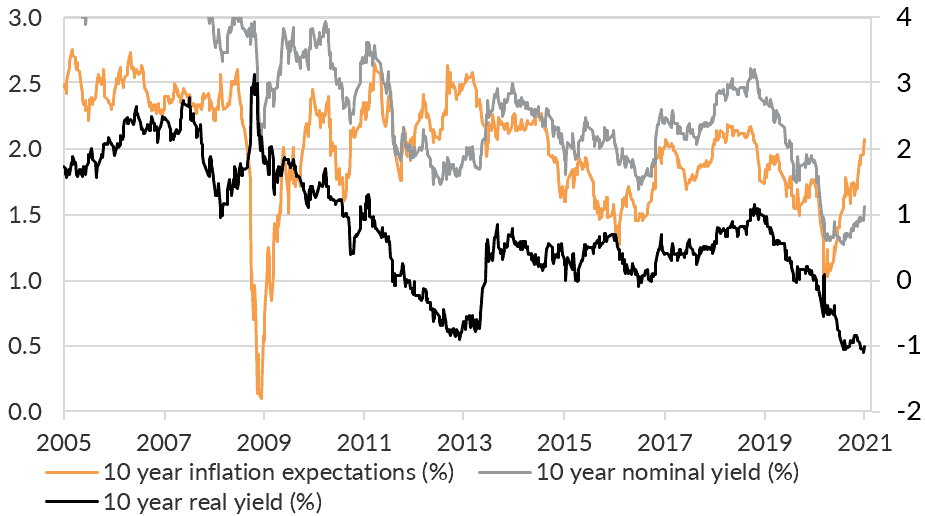
The steepening yield curve has been driven by a higher 10-year nominal yield. Figure 2 shows that increase has not been met by an increase in real (inflation adjusted) yields. As a result, inflation expectations (the difference between the nominal and the inflation adjusted yield) have increased.
Figure 2: Real yields have not increased, reflecting higher inflation expectations.
Growth, inflation, and value
The moves in the yield curves have three important implications.
- Subdued growth expectations. Low real yields indicate markets are still worried about real growth expectations, despite the rollout of vaccines and the strong recovery to date.
- Higher inflation expectations. The fiscal support likely from the Biden-administration has increased inflation expectations over the near-term.
- A better outlook for value and financial stocks. The steeper nominal yield curve will increase profitability in the financial sector, and be supportive of a rotation to financial and value sectors.
Keeping it real
We reflected the implications above in our SMA and MDA portfolios in Australia, and our discretionary portfolios in Hong Kong, using dynamic asset allocation through 2020. Our portfolio performance has benefited with strong returns (available on request).
Looking ahead through 2021 and beyond, we are focused on movements in the real yield. We expect the real yield to move higher, pacing the nominal yield and indicating market expectations for a stronger recovery. That will be another signal of tailwinds to global equities, and headwinds to sovereign bonds.
Reach out to our Portfolio Advisory Service to find out how we can assist you with managing your investment challenges.
This presentation material and all the information contained herein is the property of Oreana Financial Services Limited (OFS), and is protected from unauthorised copying and dissemination by copyright laws with all rights reserved. This presentation material, original or copy, is reserved for use by authorised personnel within OFS only and is strictly prohibited from public use and/or circulation. OFS disclaims any responsibility from any consequences arising from the unauthorised use and/or circulation of this presentation material by any party. This presentation material is intended to provide general information on the background and services OFS. No information within this presentation material constitutes a solicitation or an offer to purchase or sell any securities or investment advice of any kind. The analytical information within this presentation material is obtained from sources believed to be reliable. With respect to the information concerning investment referenced in this presentation material, certain assumptions may have been made by the sources quoted in compiling such information and changes in such assumptions may have a material impact on the information presented in this presentation material. In providing this presentation material, OFS makes no (i) express warranties concerning this presentation material; (ii) implied warranties concerning this presentation material (including, without limitation, warranties of merchantability, accuracy, or fitness for a particular purpose); (iii) express or implied warranty concerning the completeness or relevancy of this presentation material and the information contained herein. Past performance of the investment referenced in this presentation material is not necessarily indicative of future performance. Investment involves risks. Investors should refer to the Risk Disclosure Statements & Terms and Conditions of the relevant document for further details. This material has not been reviewed by the Securities and Futures Commission of Hong Kong.
Related Posts

Insights
Read our latest insights to help you make better investment decisions and build stronger portfolios.

Melbourne
Level 17, 627 Chapel Street, South Yarra, Melbourne, Victoria, 3141
Australia
T +61 3 9804 7113
F +61 3 9804 8377
Please email your request to
info@oreanafinancial.com
Sydney
Level 3, 31 Alfred Street,
Sydney, NSW 2000
Australia
T +61 3 9804 7113
F +61 3 9804 8377
Please email your request to
info@oreanafinancial.com
Hong Kong
Suite 1002, 10th Floor
Cambridge House, Taikoo Place
979 King’s Road, Quarry Bay, Hong Kong
T +852 3185 0200
F +852 2110 0736
Please email your request to
info@oreanafinancial.com


A Licensed Financial Firm
In Hong Kong we are licensed by the Securities and Futures Commission (license no. AHX191), the Insurance Authority (license no. FB1443) and the Mandatory Provident Fund Authority (license no. IC000563).
In Australia we are licensed by the Australian Securities and Investments Commission (AFSL No: 482234, ABN 91 607 515 122).